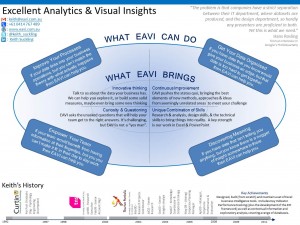
EAVI provides a range of outputs to help teams come to grips with their information. In some cases the information is static and presented in a static graphic – the EAVI “résumé” shown here offers some ideas about what this might look like.
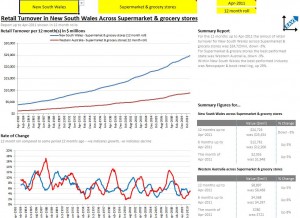
EAVI also works to give teams a more dynamic way to make use of their information and keep up with it as it updates. The example Excel file (it will work for Microsoft Excel 2007 or 2010 – it would work with some alteration in older versions of Excel) demonstrates some of the features EAVI could build into a customised dashboard, interactive report, or a purpose-built analytical tool.
The work EAVI does in this area is more easily described by saying what these elements are not. EAVI tools & dashboards are not:
- full-blown business intelligence solutions (more like a more economical cheats version),
- databases designed for the analyst (more like a tool for the business user, with simple answers served up),
- charts that add one more point as new data becomes available (more like an easy exploration where key information jumps out at you).
If any of this sounds like it might be something your business could use then please contact Keith.


